Lollipop graphs are essentially modified Bar graphs in which the bars are represented as thin lines so you can fit more in a small area, with small circles to represent mouse-over points. There are eight types of Lollipop graphs in Domo, all of them modified versions of familiar Bar and Line Bar graphs. For more information about these graphs, see Lollipop Chart.Documentation Index
Fetch the complete documentation index at: https://domoinc-arun-raj-connectors-domo-480814-upadate-new-checkbo.mintlify.app/llms.txt
Use this file to discover all available pages before exploring further.
Chart Type | Equivalent Bar Graph | Example |
|---|---|---|
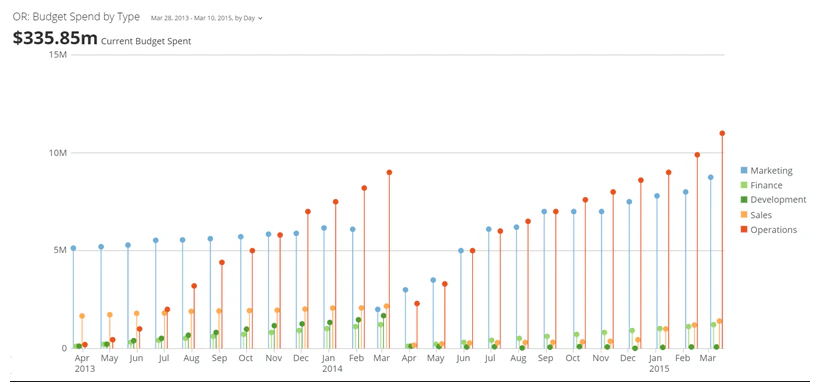
Grouped Lollipop
|
| |
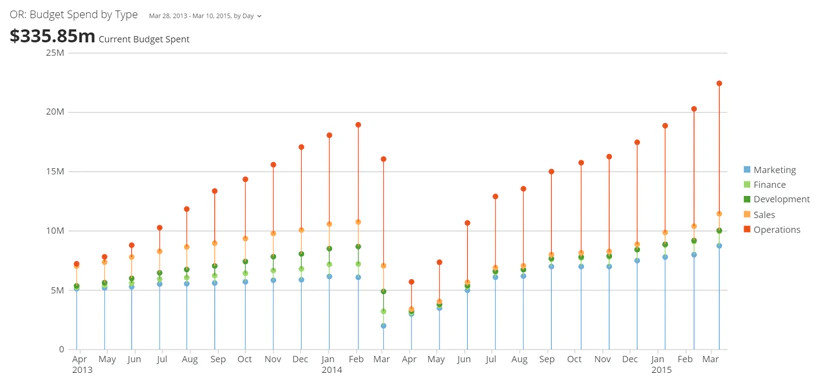
Stacked Lollipop
|
| |
Grouped Lollipop with Line
|
| |
Stacked Lollipop with Line
|
| |
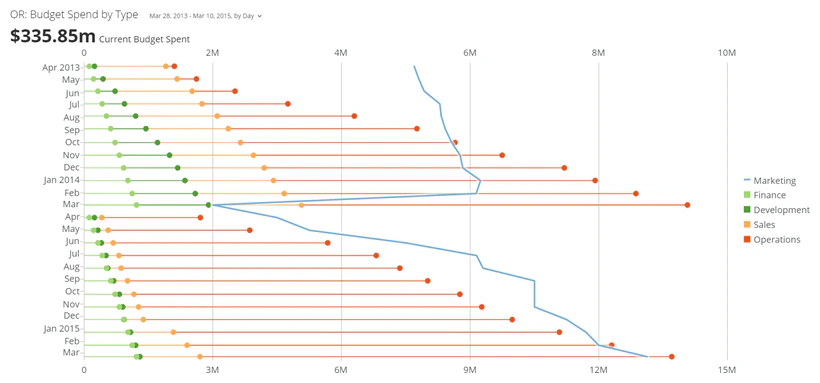
Horizontal Grouped Lollipop
|
| |
Horizontal Stacked Lollipop
|
| |
Horizontal Grouped Lollipop with Line
|
| |
Horizontal Stacked Lollipop with Line
|
|