Documentation Index
Fetch the complete documentation index at: https://domoinc-arun-raj-connectors-domo-480814-upadate-new-checkbo.mintlify.app/llms.txt
Use this file to discover all available pages before exploring further.
Intro
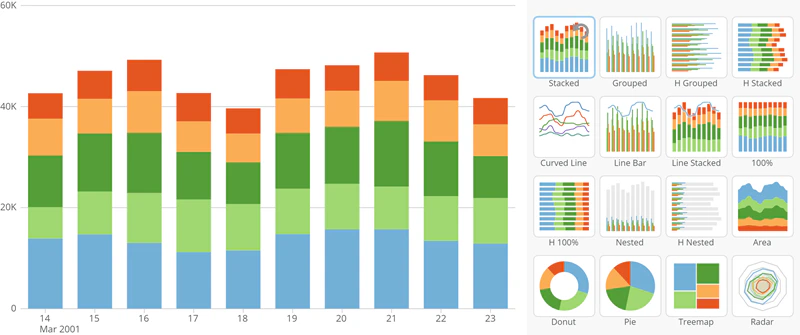
These tools include the following:New Chart Type Picker
You can now change the chart type for most charts right in the Details page instead of having to first open the Card Builder. You do this by clicking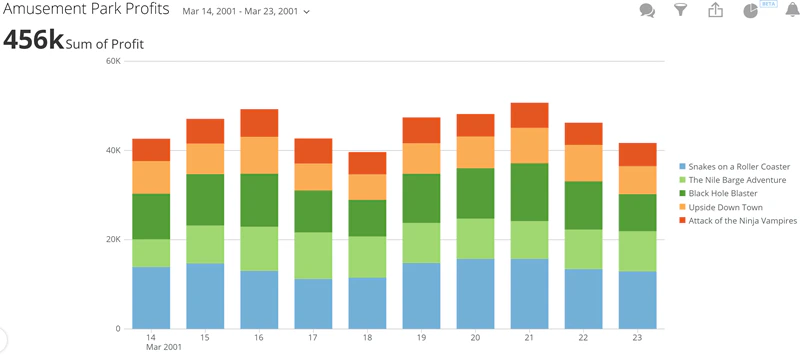
Legend Item Toggle
In most chart types with legends (excluding Maps), you can now click on a legend item to hide or show the corresponding data in the chart. Referring to the “Amusement Park Profits” example again…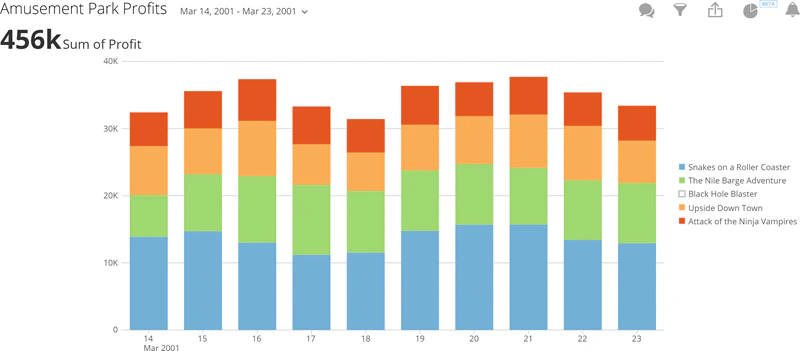
Note: Be aware that if you hide data in a chart by toggling a legend item, it is still hidden when other users go into the Details view; however, they can show it again by clicking that legend item. If you want to hide data from users, you should use PDP instead.
Chart Zoom
You can click and drag over a portion of a chart to “zoom in” on that portion. This works on most chart types, excluding pie-type charts, maps, gauges, Radar graphs, and a few others. Referring to the same example as previously…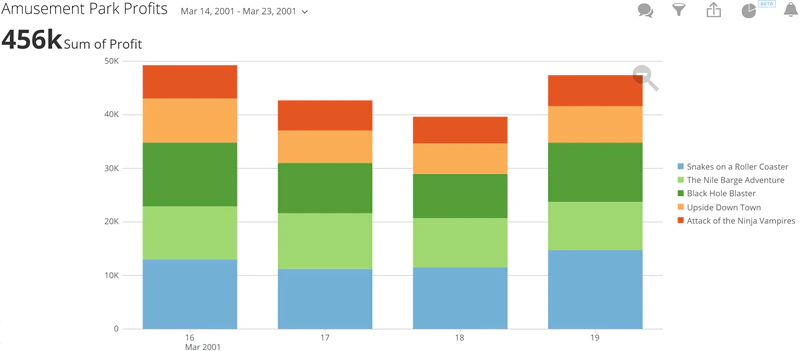
Quick Sort
For most Bar and Line graphs, you can now quickly change the sort method just by clicking an icon, without having to open the Card Builder. This icon appears when you mouse over either the x- or y-axis of the chart. Five versions of this icon appear in a cycle; clicking any version sorts the graph accordingly, and the icon changes to the next version in the cycle. The following table lists and describes the sort methods associated with each version of the icon:| Icon | Description |
|---|---|
| Sorts the data items in the graph using the default sort (i.e. the same way they were sorted when the graph was created). | |
 | Sorts the data items in the chart in order of ascending values. |
 | Sorts the data items in the chart in order of descending values. |
 | Sorts the data items in the chart in ascending alphanumeric category order. |
| Sorts the data items in the chart in descending alphanumeric category order. |
Chart Save As
When you make changes to a chart in the Details view (whether by using any of the above features or filtering using the Analyzer tool), you can now save a copy of the edited chart to your Domo. You do this by clicking the-
Select
 > Save As.
- (Optional) Change the title of the card if desired. (All duplicated cards incorporate the “Copy of” text in the name by default).
- (Optional) Enter a description of the new card. This is highly recommended, as it will help your viewers figure out what has changed.
- Select the page where the new version of the card should live.
- (Optional) Uncheck the box at the bottom of the screen if you do not want to be taken to the Details page for the new card after saving; otherwise leave the box checked.
- Click Save.
Data Forecasting
A new chart property for Bar and Line charts allows you to forecast the value of the remainder of the current period in your chart. It does this by taking the current value for the period and comparing it to the previous period. For example, in the following chart, the current month, October, is not yet over, so the user applies the Forecast property. The light blue represents the forecasted value for the entire month of October.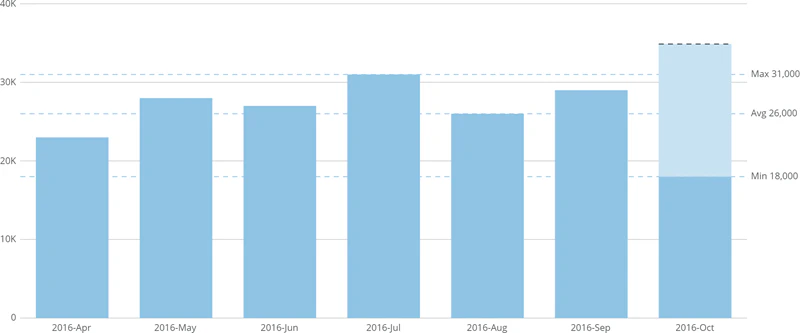
- Open the Card Builder for the line or bar chart you want a forecast for.
- In Chart Properties, click Last Value Projection.
- In the Project Using menu, select Forecast Value.